How much return will I make?
Are we there yet?
While both are important questions, the questions cannot be answered without first understanding traffic, lanes, roads, vehicles etc.
If you don’t know what we are talking about, please read our previous blogs that explain how portfolios work. Without that understanding, this blog may seem a little esoteric!!
Understanding the Efficient Frontier
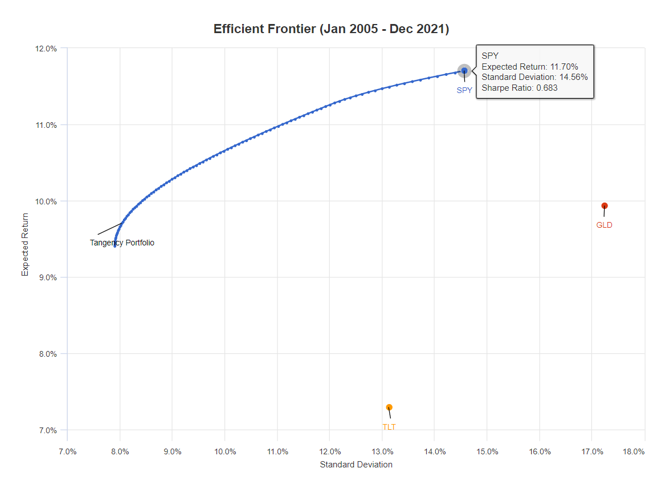
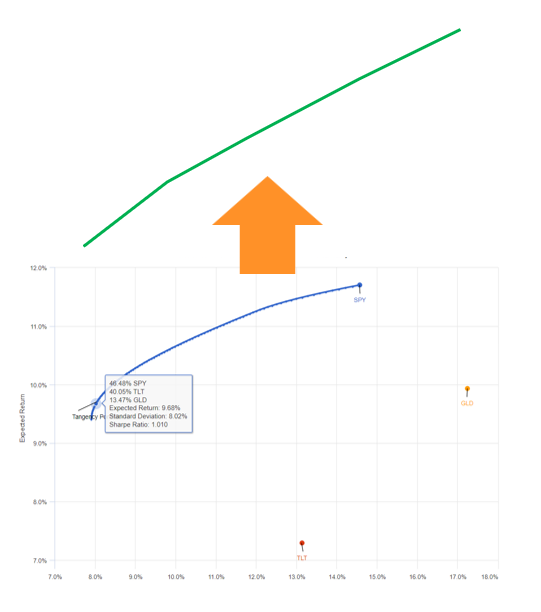
The chart on the left is from Portfolio Visualizer
(website for investment research)
X-Axis represents risk using historical standard deviation
Y-Axis represents historical annual returns
The chart essentially maps your desired risk with the return that you will get for that risk and vice-versa
Definitions: Standard Deviation, MAR Ratio, Sharpe Ratio
Stocks vs. Bonds
Investing in the S&P 500 (SPY) for example from 2005 onwards would have given you a 12% return, but with a “risk” of 14.5%.
Investing in Bonds (TLT) would have given you a lower return of 7%, but the “risk” would also have been lower at around 13%
Managing Emotions
The first thing that as an investor you should do is to understand your own risk appetite.
Investing in Bonds with the 13% standard deviation would have translated to a 21% drop in your portfolio in 2009.
Investing in the S&P 500 for e.g., with the 14.5% standard deviation would have translated to a 50% drop in your portfolio during 2008-2009.
Would you have trusted your emotions to stayed invested then?
Managing Emotions
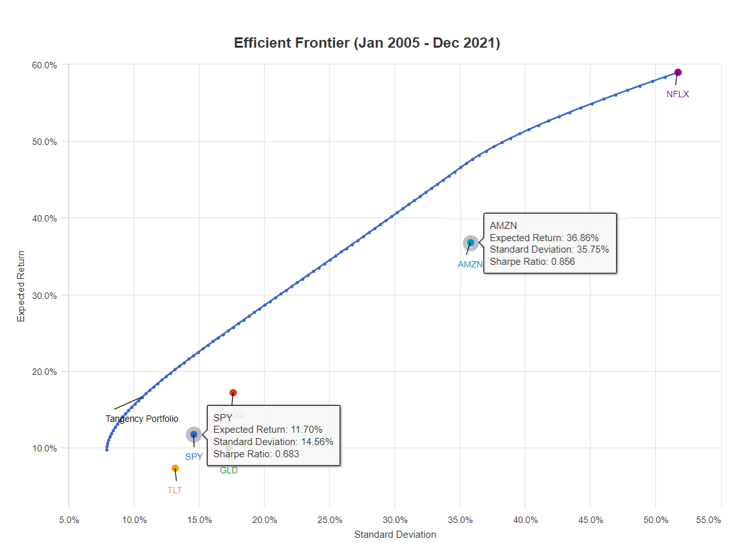
The risk-return trade-off applies to all investments.
Investing in Amazon would have given an annual return of 37% but translated to a 93% drop in your portfolio from 1999 to 2000.
Would you have trusted your emotions to stay invested in Amazon then?
Using the Efficient Frontier
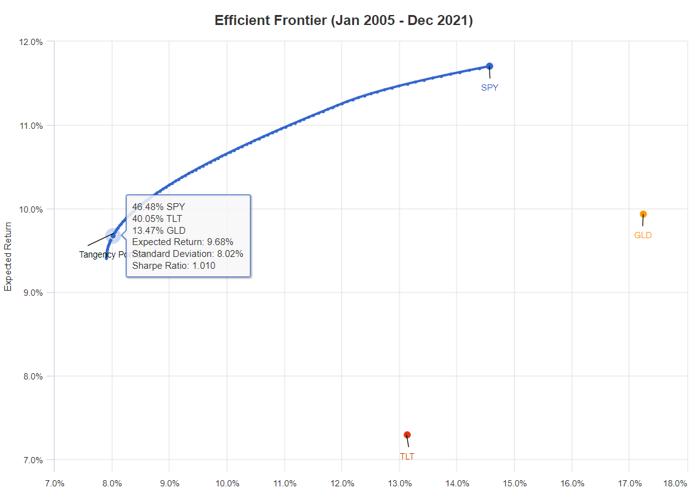
You can use the efficient frontier to determine your own risk-return trade-off.
For a risk equivalent to an 8% standard-deviation, the ideal portfolio constructed between stocks, bonds and gold would be 47% in stocks, 40% in bonds and 13% in gold.
Keep in mind though that these are all based on historical data and assume history repeats
Our Models
Thanks to the diversification techniques we covered in our other blogs (Asset, Time, Insurance), our models target an efficient frontier that is significantly better than traditional portfolios.
What that means for investors is that for a level of risk that you decide, we strive to deliver a higher return
Still Esoteric? Schedule some time with us if you want to understand this better