
Simple Tweak
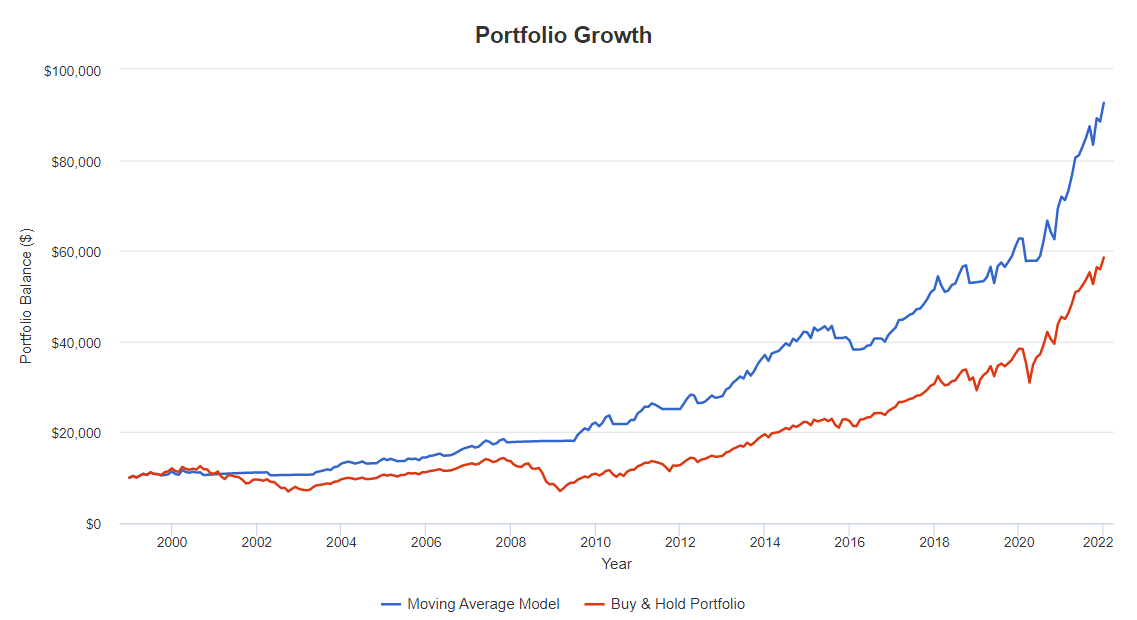
Consider the charts on the left. The red line represents the stock market without any risk mitigation strategy
Average return of 9%, but with a 50% drop in portfolio between 2008-2009. It also took the S&P 500 5+ years to recover that drop.
The blue line represents a "simple risk mitigation plan", where you exit the stock market when it drops below the 8 month moving average and move to cash.
Average return of 10%, with a 12% drop in portfolio between 2008-2009. The recovery time was also much faster, just 2 years.
Slight increase in returns, but a potential reduction in risk.

Simple right??
All you need to do is to invest in the S&P index ETF SPY and on the first of the month check whether the SPY is above the 8 month moving average. If it is...stay invested. If not...move to cash
Not really....
The difficulty here is not in executing the strategy, but in managing your emotions. Most people are not able to manage the emotion and discipline associated the strategy above. But if you are among the few that are able to manage; congratulations... you took your first step towards making more educated investment decisions.