
Low Volatility, High Curiosity: Making Sense of VIX
The VIX is sitting well below its historical average, suggesting investors expect a relatively calm market ahead. History shows that low volatility has often coincided with positive returns, but it also shows that calm conditions can change quickly.
Executive Summary
The Short Version
The VIX is a number that shows how much stock market movement investors expect. Wall Street calls it the "fear gauge". It closed at 14.7 on August 13, 2026. That is lower than its own average over the past month, three months, one year, five years, and ten years. Those averages were all between about 17 and 19. In short, investors expected calmer trading than usual.
This might seem strange. Stocks still moved around a lot that year. The S&P 500 was up about 13% through August 13, 2026. That is not a smooth, steady ride, so you might expect the VIX to be higher. It was also a midterm election year. Those years have often brought more ups and downs to the market.
History can help explain this, but it cannot predict what comes next. Past midterm years usually had much higher VIX levels than August 2026 did. Also, when the VIX has dropped below 16 in the past, stocks usually went up in the months that followed. Neither fact tells us what will happen this time. But both help explain why a calm VIX reading is not strange or worrying on its own.
Why the VIX Is Low
The VIX comes from prices that investors pay for S&P 500 options. It shows how much movement the market expects over the next 30 days. It does not predict whether stocks will go up or down, only how much they might move. A VIX of 14.7 means investors were not paying much for protection. As the image below shows, this level was lower than every longer term average, from the one month average near 17 up to the ten year average near 18.6.
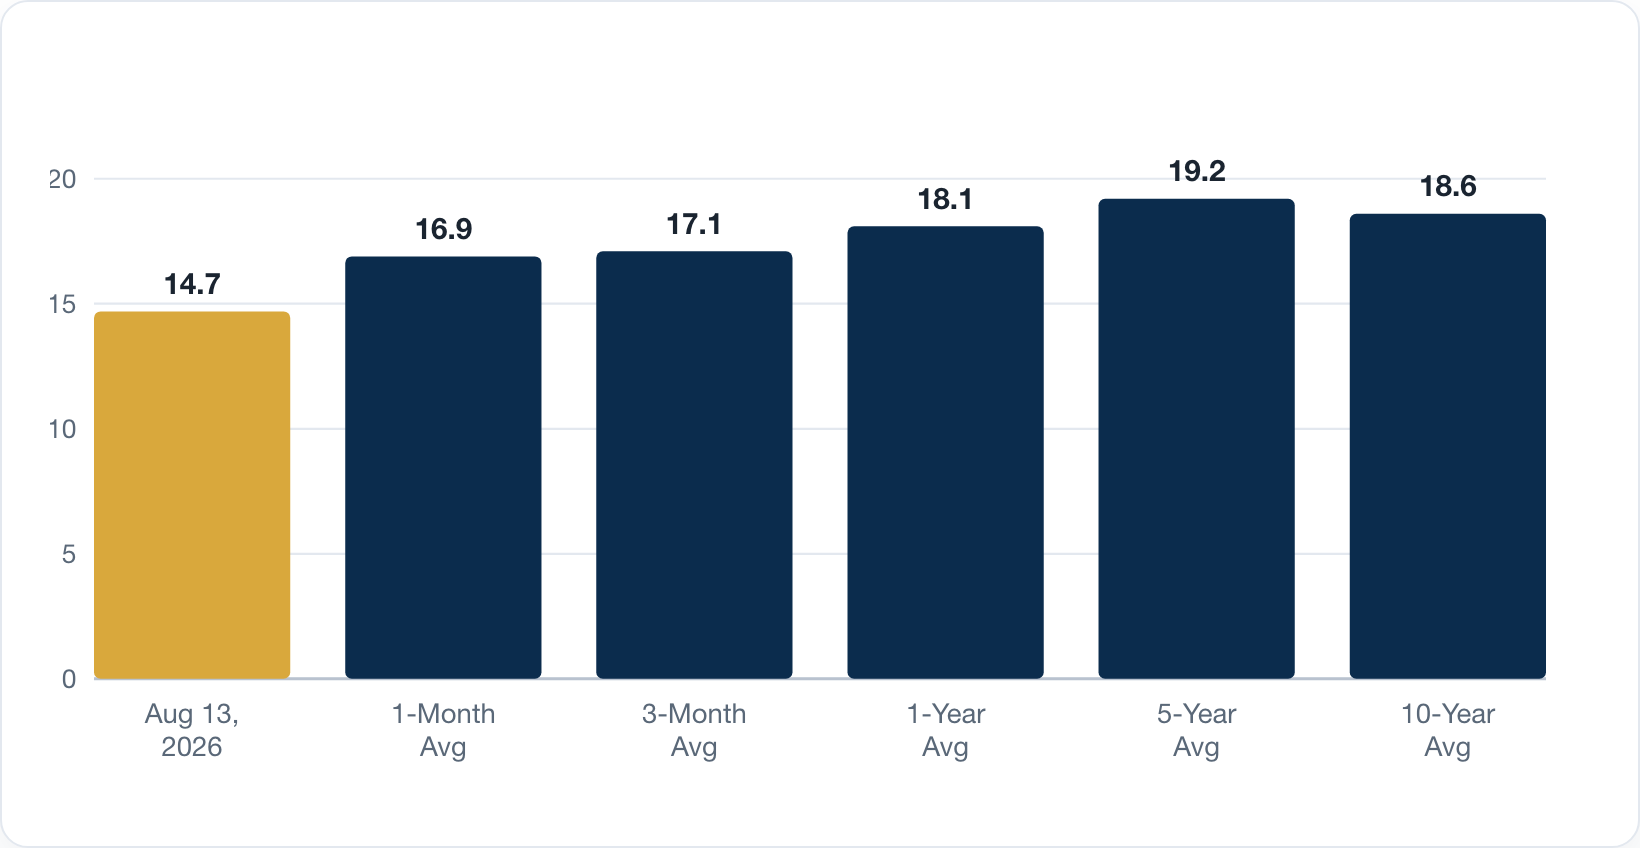
VIX on Aug 13, 2026 vs historical averages. Source: CBOE VIX historical data.
This does not mean stocks stood still. Real volatility in the S&P 500 over the prior 30 days was about 12.3% a year, even lower than the VIX. That might sound confusing, but it is normal. The VIX usually runs a little higher than real volatility. Investors who sell options are paid extra for taking on risk, so the VIX carries a small built in cushion. When that cushion shrinks or disappears, it is often a bigger warning sign than the VIX level itself.
In short, a VIX below 16 during a year with regular ups and downs is not unusual. It simply shows those swings stayed inside a range that felt normal to investors. It also shows investors were not paying extra to protect against a sudden shock.
Note: the 1-month, 3-month, 1-year, 5-year, and 10-year figures are trailing averages measured back from August 13, 2026.
Midterm Years in Perspective
Midterm election years often bring more market swings than usual, and the data backs this up. Looking at seven past midterm years (1998, 2002, 2006, 2010, 2014, 2018, and 2022), the average VIX was about 20.7. That is much higher than the 14.7 reading on August 13, 2026, shown in the image below. Three of those years, 2002, 2010, and 2022, had an average VIX above 22. Each one came during a period of economic stress: the dot-com crash, the aftermath of the financial crisis, and the 2022 inflation surge.
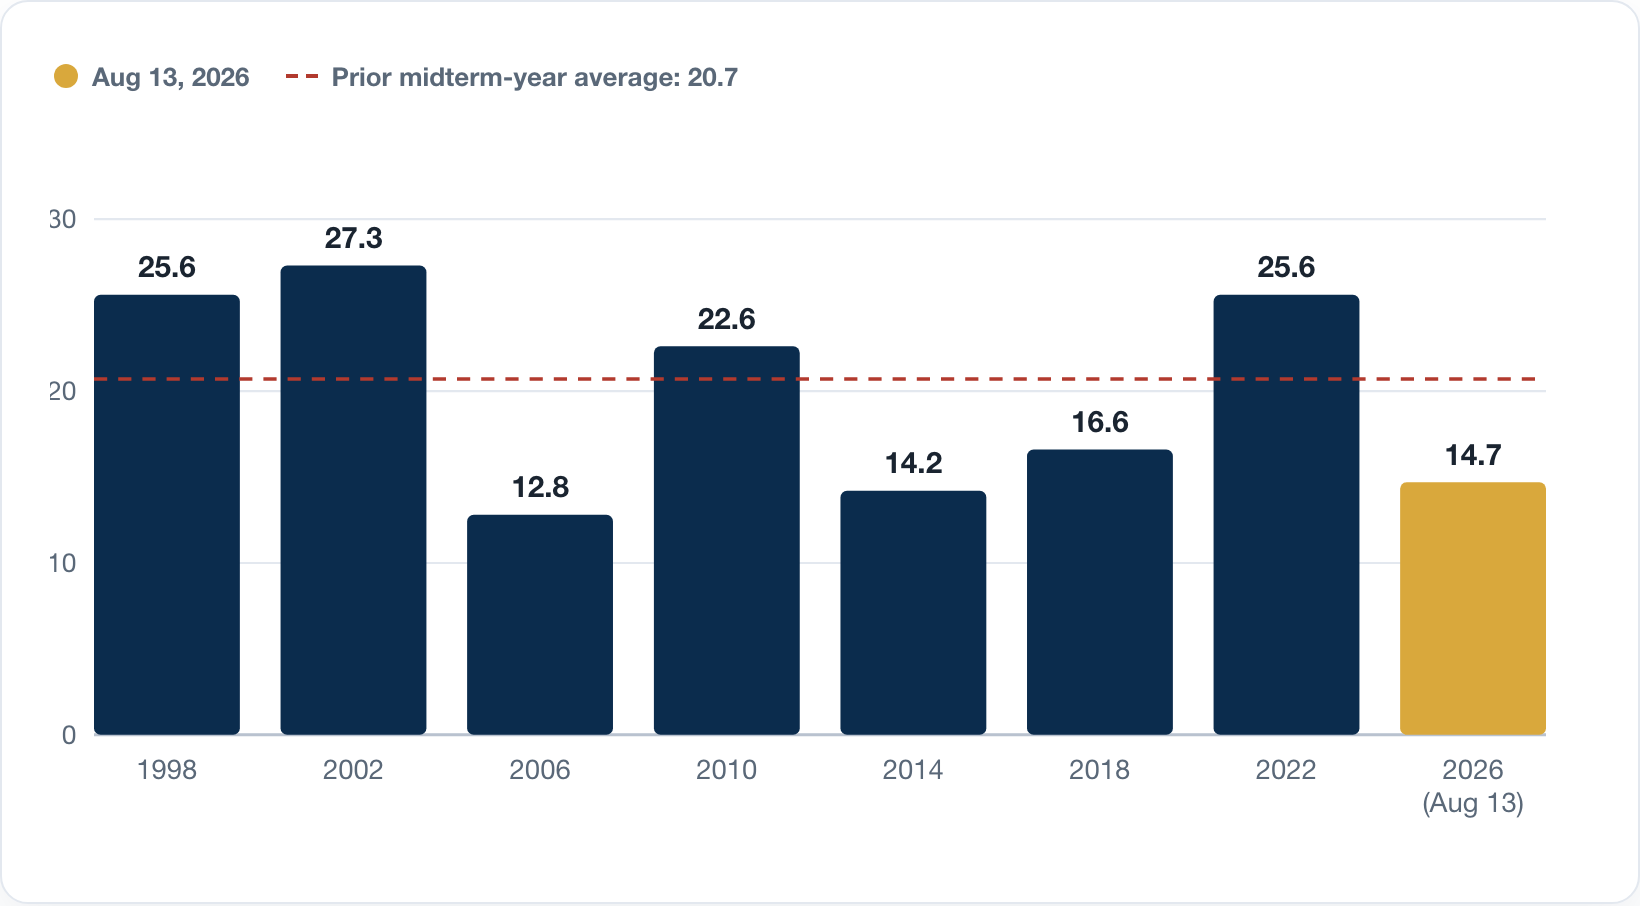
Average VIX for each midterm election year, 1998–2026. Source: CBOE VIX historical data.
But the pattern is not the same every time. 2006 and 2014 were calmer midterm years, with average VIX levels of 12.8 and 14.2. Both were below the August 2026 level. Full year S&P 500 returns across all seven midterm years were mixed, averaging about 1.5%. Four of the seven years ended positive. But even years that ended higher still had big drops along the way. On average, stocks fell about 18.5% from their high point sometime during each of these years.
The point is not that a low VIX is unusual for a midterm year. Calm midterm years have happened before. The bigger point is that midterm years, as a group, often start calm and grow more turbulent later on.
Three of the midterm years already covered above, 2006, 2014, and 2018, had the calmest average VIX levels of the group, at about 12.8, 14.2, and 16.6. Each of these years also had a different pattern between its first half and second half. In 2006, the S&P 500 was nearly flat in the first half, then rose close to 11% in the second half. In 2014, the pattern flipped: stocks gained about 7% in the first half and a smaller 4% in the second half. In 2018, the S&P 500 was roughly flat in the first half, then fell about 8% in the second half, contributing to a maximum drawdown of about 20% for the year.
The image below also shows the full-year return for the year that followed each of these calm midterm years. After 2006, the S&P 500 rose again in 2007, though by a smaller 3.6%. After 2014, 2015 was roughly flat, down about 0.7%. After 2018, stocks rebounded sharply in 2019, up nearly 29%.
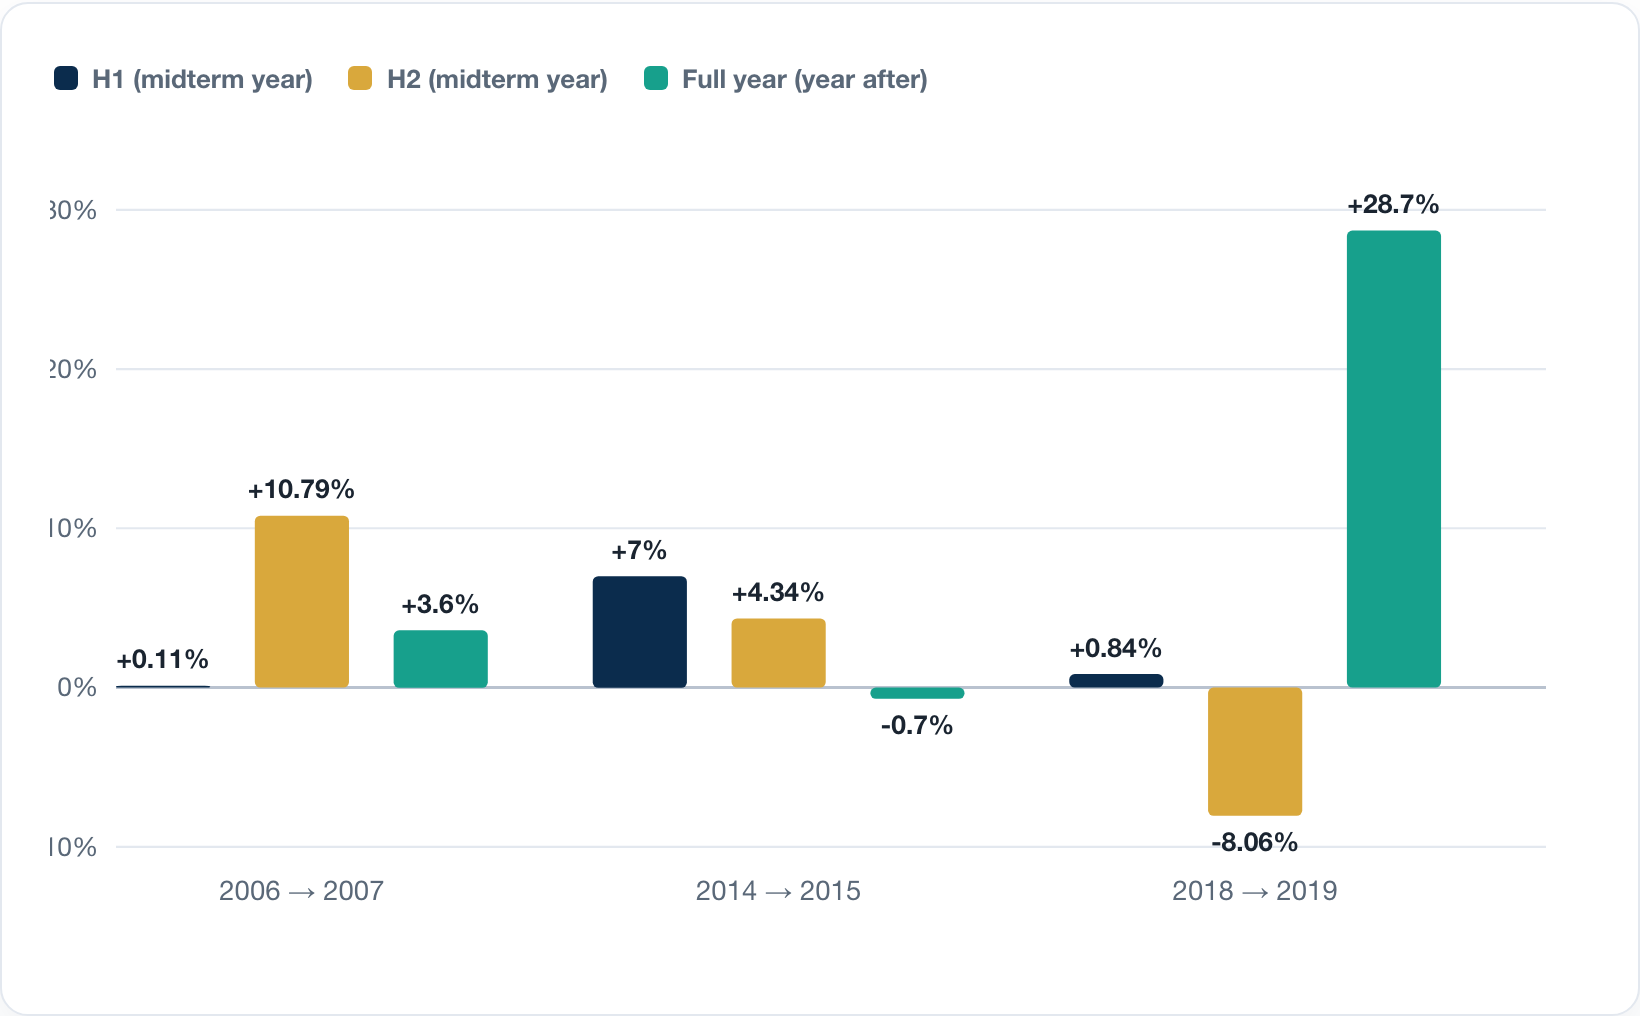
S&P 500 first-half and second-half returns for 2006, 2014 and 2018, with the full-year return for the following year. Source: S&P 500 historical price data.
This spread of outcomes, both within each low-VIX year and in the year that followed, is a reminder of what the VIX actually measures. A low or moderate VIX points to smaller expected price swings. It does not point to which direction the market will move, or how long calmer conditions will last.
Second-Half Returns and Drawdowns in Midterm Election Years
S&P 500 first-half return, second-half return, and second-half maximum drawdown for each midterm election year, 2002–2022
Year | H1 S&P 500 Return | H2 S&P 500 Return | H2 Maximum Drawdown |
|---|---|---|---|
2002 | -14.28% | -9.17% | -21.46% |
Calm VIX 2006 | +0.11% | +10.79% | -3.57% |
2010 | -9.03% | +22.41% | -7.14% |
Calm VIX 2014 | +7.00% | +4.34% | -7.40% |
Calm VIX 2018 | +0.84% | -8.06% | -19.78% |
2022 | -21.08% | +0.37% | -16.91% |
Note: drawdown figures are calculated on a yearly basis (the largest peak-to-trough decline within the second half of each year), not on a monthly basis. Source: S&P 500 historical price data.
The table above adds one more layer to the second-half comparison already covered: how much of a drop each year experienced along the way. The pattern is not consistent. In 2006, a positive second-half return of about 11% came with a shallow drawdown of under 4%, a relatively smooth path. In 2010, the second half also finished strongly positive, up over 22%, but that gain still included a drawdown of roughly 7%. In 2018, the second half turned negative, down about 8%, alongside a much deeper drawdown near 20%. A positive second-half return did not always mean a calm ride to get there, and a relatively subdued average VIX for the year did not rule out a meaningful drawdown along the way.
Returns After a Low VIX
Going back to 1990, there have been thousands of days when the VIX closed below 16. The image below shows what stocks did, on average, in the months after those days. Returns were positive on average across every time period studied. Stocks were up about 0.6% one month later, 2.1% three months later, 5.1% six months later, and 11.1% a year later. Stocks also finished higher more often as time passed: about 65% of the time after one month, growing to almost 88% of the time after a year.
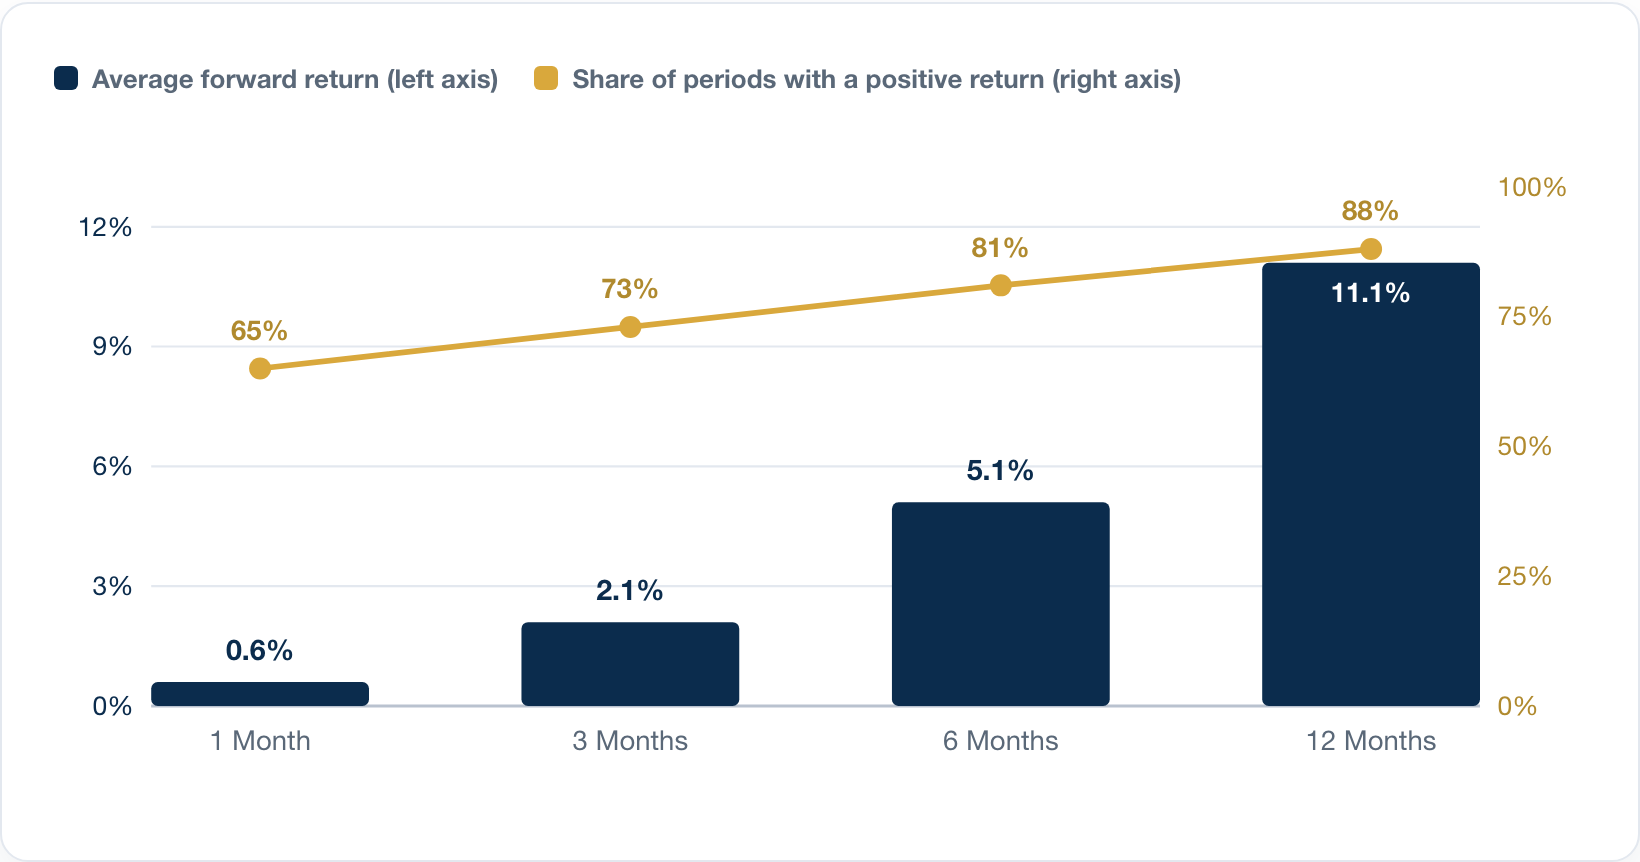
Forward S&P 500 returns following VIX closes below 16, 1990–2026. Source: CBOE VIX historical data and S&P 500 historical price data.
These are past averages, not guarantees. The range of outcomes was wide. Looking just at the one month results, the worst case was a loss of about 32%, and the best case was a gain of about 10%. This shows a low VIX has come before both strong rallies and sharp drops. The numbers describe what happened after similar conditions in the past. They do not tell us what will happen this time.
How to read this chart: the bars represent average forward returns, while the line shows the percentage of observations that generated positive returns. For example, when the VIX was below 16, the S&P 500 delivered an average return of 0.6% over the next month and was higher one month later in 65% of observations. The chart applies the same methodology across 3, 6, and 12-month periods.
Calm Is Not the Same as Safe
It helps to remember what the VIX actually measures. It shows what investors expect for the next month, based on option prices at that moment. It is a snapshot, not a permanent state. It can change quickly.
A low VIX shows conditions at one moment. It does not mean conditions will stay calm.
History gives a clear example. From August 2017 to early February 2018, the VIX stayed below 11 on average for almost six months. That was one of the calmest stretches on record. Then, in early February 2018, volatility spiked sharply within just a few days. This is a reminder that a long calm stretch does not protect against a sudden shock. That does not mean calm periods usually end badly. Most of them do not. But a low VIX only tells you about market conditions right now. It does not promise how long those conditions will last.
Key Takeaways
- The VIX closed at 14.7 on August 13, 2026. That is lower than its 1 month, 3 month, 1 year, 5 year, and 10 year averages. This shows investors expected fairly small market moves in the near term.
- On that date, the VIX was a bit higher than real market volatility, which was 12.3%. This gap is normal. It does not mean investors were too relaxed.
- Midterm election years have historically had a higher average VIX, about 20.7, than the August 2026 level. Still, results have varied a lot from year to year.
- In the past, stocks usually rose in the months after the VIX fell below 16. This held true across 1 month, 3 month, 6 month, and 12 month periods. But results varied a lot, and some periods had real losses.
- A low VIX shows conditions at one moment. It does not mean conditions will stay calm. A calm stretch in 2017 and 2018 lasted nearly six months, then ended suddenly. Low volatility is not the same as low risk.
Get in Touch
If you'd like to discuss what current market volatility means for your portfolio, reach out at wealth@mytimeequity.com and we'll set up a time to discuss your investment strategy.
Prefer WhatsApp? Join our group for market updates and insights.
This briefing is for informational purposes only and does not constitute investment advice. The VIX is a measure of expected market volatility, not a forecast of market direction, and past patterns in VIX levels and subsequent returns do not guarantee future results. All investments involve risk, including potential loss of principal.
Disclaimer: MyTimeEquity is a state-registered investment adviser. Information shared is for educational and informational purposes only and should not be construed as investment, legal, tax, or accounting advice, or as a recommendation to buy or sell any security. Views expressed are subject to change without notice.